


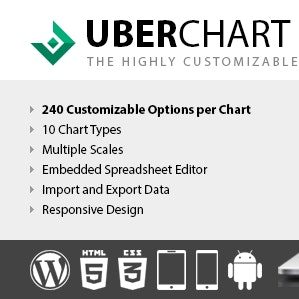

UberChart is an advanced WordPress Chart Plugin which gives you the ability to create a great variety of charts with exceptional customizability. With a total of 240 options per chart and 30 options per dataset you will always be able to create exactly the chart you need.

Create your perfect chart
The available chart types are:
- Line Charts
- Area Charts
- Bar Charts
- Horizontal Bar Charts
- Pie Charts
- Doughnut Charts
- Radar Charts
- Polar Area Charts
- Scatter Charts
- Bubble Charts
After you select the chart type you can start with the customization, check out this screenshot of the Charts Menu with all the sections opened to have an idea of the extremely high number of available options.
GENERAL OPTIONS
These options are used to define the general behavior of the chart and the aspect of some of the elements of the chart (datasets and scales have their own customization options, see the specific sections for details), for example you can:
- Set the chart size, margin and background color
- Enable or disable the responsiveness of the chart
- Select the speed and the type of animation
- Set size, color, font family, font style and position of the chart title
- Set size, color, font family, font style and position of the text in the chart legend
- Set the style of the tooltips
DATASETS CUSTOMIZATION
You are free to decide how each dataset of the chart should appear, for example you can:
- Define the bezier curve tension of each line, this allows you to represent straight or curved lines
- Define the width of each line, create dashed lines with custom gaps and also select the lineCap and lineJoin canvas properties of each line
- Set the point style of each point (circle, triangle, rectangle, cross, line, star, dash and more)
- Select how each point should react when hovered, for example you can define the exact radius that reacts to the hover mouse event
- Set the radius, the border and the background color of each point or bubble (in both hover and default status)
- Set the background and border color of each single bar displayed in a bar chart (in both hover and default status)
- Set the background and border color of each arc displayed in a Polar Area, Pie or Doughnut chart (in both hover and default status)
TYPES OF SCALES
UberChart gives you the ability to use different types of scale:
Linear Scales
This the most common type of scale, use it each time you have to represent numeric sets of values that don’t require the logarithmic scale.
Logarithmic Scales
Logarithmic scales allow a large range to be displayed without small values being compressed down into bottom of the graph. This type of scale is essential if you deal with points that are much larger or smaller than the bulk of data or if you want to show multiplicative factors.
Time Scales
Use the time scale when you have to represent a specific date or time. The format used to represent the date/time is completely customizable. Simply use the tokens provided by Moment.js to define a custom format, then set the time unit used by the scale and define the number of units that should be plotted between the grid lines.
Category Scales
Use the category scale to split your data in multiple categories and display custom labels.
MULTI AXIS
You can plot one or more datasets on the additional secondary axis named Y2 when the values in a chart vary widely from one dataset to the other.
STACKED DATA
Feel free to enable or disable the “Stacked” feature on any axis, this allows you to stack the data of the specified axis of a Line Chart, Area Chart, Bar Chart or Horizontal Bar Chart.
SCALE POSITION
You can move the scales in your favorite positions, for example you can represent the Y axis of a Line Chart on the right instead of on the left, the X axis of a Bar Chart on the top instead of on the bottom, etc.
HIDE THE SCALES
Sometimes it’s useful to represent only the datasets without a scale or without all the scales. Use these options to display or hide specific scales.
SCALE GRID LINES
Customize the visibility, the width, the colors and more for each grid line. This allows you to be extremely detailed and highlight small variations on your data when needed or make the chart layout neat and clean.
SCALE TITLE
Change how the title of each scale is displayed by changing the color, the font size, the font family and the font style.
SCALE TICKS
Add a prefix or a suffix to the ticks of a scale (for example to include a unit of measurement, the percentage symbol, the dollar symbol, etc.), invert the order of the ticks, rotate the ticks to save space, round the decimal value to a specific number of decimal places and more.
ADDITIONAL CUSTOMIZATIONS
Set a minimum and maximum limit for each scale, set a fixed step size, decide to begin at zero or not your scale, limit the number of ticks of a scale to a predefined value, customize the dimensions of the bars of a Bar Chart and more.


3 reviews for UberChart – WordPress Chart Plugin
I need Installation support.
Very fast delivery.
Required update version.